Let’s face it: As developers, much of our time is spent fixing problems. No matter how hard I try, there’s always something that needs debugging. In the past, I would use console.log or alert. Just sprinkle them in my code, and hope that they give me enough information to fix the problem.
If you’ve tried doing that, you know that it’s not a very good approach. It’s like giving a surgeon a machete instead of a scalpel - not accurate and a bad tool for the job.
But just like surgeons have scalpels, we have better tools available for us too: Namely, debuggers. In this article, I’ll show you how to make use of Chrome’s JavaScript debugger to help you fix errors faster and more easily.
Getting started
To get started, we can open up the Developer Tools either through the menu, by right clicking the page and choosing “Inspect Element”, or by pressing F12 (or Cmd+Opt+i if you’re on a Mac).
We can find the script debugger from the Sources tab of the developer tools. It’ll look something like this:
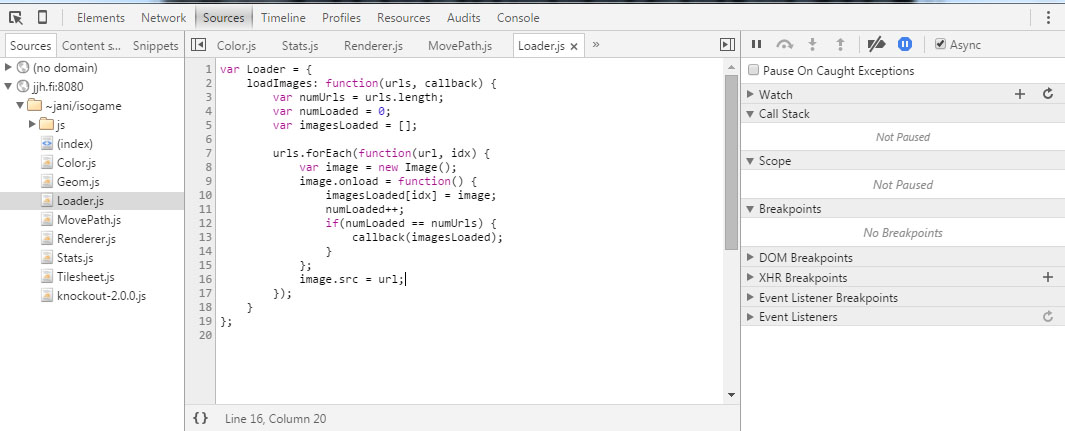
click to enlarge
We’ve got a lot of stuff in this view. In this article, we’ll be only focusing on breakpoints and stepping through the code, which can be found on the right. These are the main features of the debugger, and all the other functionality builds on top of them.
A typical debugging scenario
What happens in a typical situation when there’s an error in your JS code? It causes an exception to be thrown.
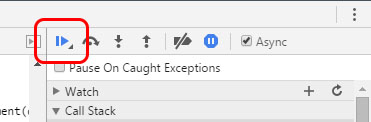
The first thing we want to do is to make sure we have “Pause on exceptions” enabled, which is the button on the right with the pause icon in it
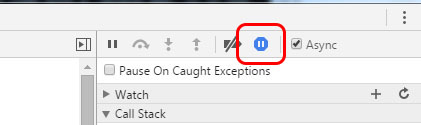
By enabling break on exception, Chrome automatically pauses code execution into the debugger for us if there’s a problem. When this is enabled, we can also optionally make Chrome pause on caught exceptions. This means that every exception that is thrown results in Chrome pausing the execution. It can sometimes be useful if the error is being handled by a library, and Chrome won’t pause on it.
Inspecting values
When Chrome pauses script execution, we can get a lot of information on what’s going on. This is one of the big benefits of using the debugger - you get access to everything the script had access to. No need to add random logging and try to guess what went wrong.
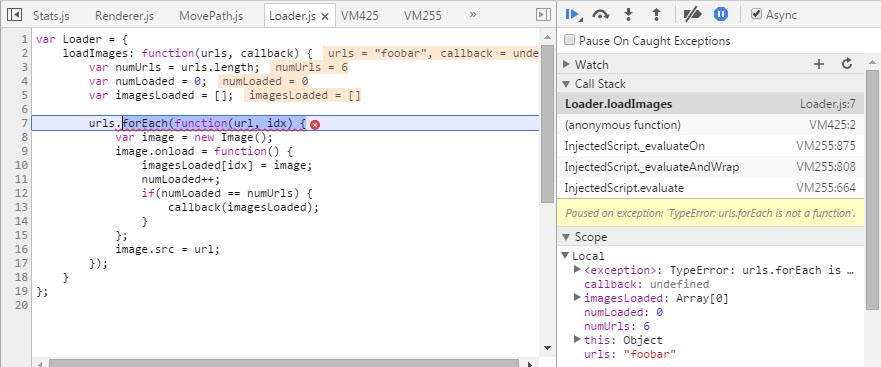
In the code view, Chrome gives us readouts on variable values. The line highlighted in blue is where the code is paused. The red icon on the line indicates an exception was thrown. We can see the error message either by hovering the cursor over the icon, or by looking on the right where it says “Paused on exception”.
We can also further inspect any variables by hovering the cursor over their names. This is especially useful for objects which may contain many properties. We can also find more variable information on the right, under “Scope”. In this panel, variables are grouped by their scope - for example, any local variables defined within the function where we are will be in “Locals”, if we are inside a closure, a grouping for variables from the closure is inclued, and finally any global variables are grouped under their respective section.
Finding the problem
The first step in finding the problem is looking at the error message. In this case, we’ve got a TypeError: urls.forEach is not a function. On the highlighted line, we can see the code is trying to call forEach.
Since the error points out that forEach is not a function, it must mean urls is an incorrect value. If we look for the value of urls by hovering the cursor over it, we can see it’s a string "foobar" - which is clearly not an array, and therefore it doesn’t have a forEach function in it.
We could stop here. We’ve identified the problem, and we could fix it by checking the variable type. However, we don’t want to do that just yet.
One of the secrets to writing robust code is to understand why something happens. A beginner would fix this bug with an if-statement that checks the type and calls it a day, but we want to be professionals. We need to identify the root cause of the problem before we fix it.
Identifying the root cause
The approach an experienced developer takes to fix bugs is to find their root cause. Sure, we could add a fix, but errors are often only a symptom of a bug, and not the actual bug. We can patch over the symptom and pretend like the bug doesn’t exist, but this just leads to messy code and tons of special-case fixes for things nobody really understands. A better approach is to fix it at the source - which often prevents future bugs, too.
We can start searching for the root cause by looking in the Call Stack on the right.
The Call Stack shows us the “parents” of this function call. Our current function is highlighted, Loader.loadImages. All the items below it are functions which were executed before entering this function - in this case, we can see the function where the code came from is an (anonymous function).
We can access all the previous functions by clicking them in the call stack list. We should try and repeat our previous steps until we find the source: Look for any variables which are being passed around with incorrect values. When we find the place where the bad value originates from, we’ve found our root cause.
In this case, the answer is simple:
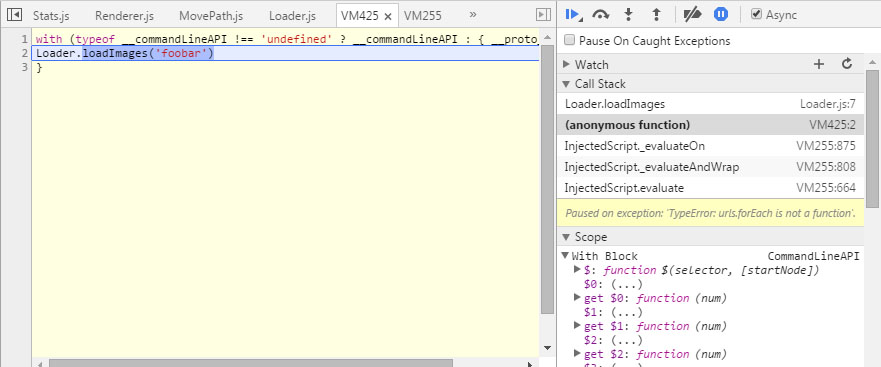
Entering the previous function, we again get the same information the script had - all the variable values etc. are shown. We can also see the line of code which called our original function.
We can see the offending code highlighted - We’re calling the loadImages function with bad parameters. If this was real code, you could now fix this problem - but in this case I typed this into the console to trigger an error.
Debugging a more complicated problem
Let’s take a look at another example. There’s a number of other features in the debugger that we can use to help debug more complex problems.
I’ve created an example snippet on JSFiddle, which we’ll debug next. This code is based on some real production code we have at my day job, but simplified so we can focus on debugging, rather than understanding what the code is doing.
This code has some logic to generate a list of objects based on any element with a class in the document. If you click the run button in the fiddle, you’ll see some output listing two objects. If you modify the HTML and include another element with a class, it’ll show up there as well.
The bug here is that we want the type to indicate "image" when the element is an IMG, but it says "other" instead.
Since we don’t have an exception being thrown, we need to use some other approach to pause the code execution into the debugger.
Using breakpoints
To pause code execution anywhere we like, we can use a breakpoint. We have two ways to set a breakpoint:
- We can set a breakpoint using a
debugger;statement - We can set a breakpoint from the script debugger
Let’s start by using the first method. Using debugger; is convenient when you have the file open and can edit it, so I’ll add it after line 9 in the fiddle.
If we click on the run button after adding the debugger statement (remember to re-run the fiddle to save the changes), the script debugger will automatically pause code on the line where the statement is.
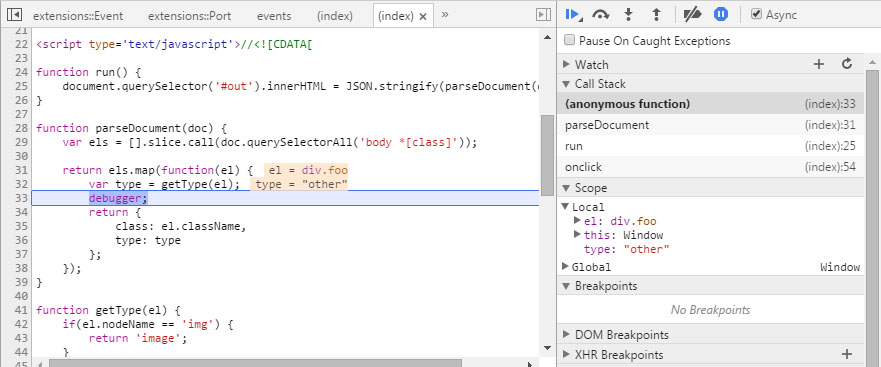
Note: the line numbers in the script debugger are different than in the fiddle.
We can see that the iteration of the forEach is currently in the div element. We want to see what happens for the image element. To do so, we can resume script execution using the button on the right that looks like a Play button.
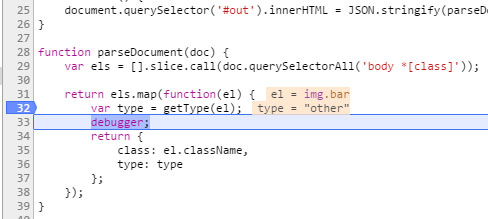
When we press it, the script is resumed, but if the engine encounters another breakpoint, it’ll again pause at it. As the debugger pauses our script for the image, we can now see that the type variable has a bad value - it’s supposed to have the value "image".
It looks like the type value comes from the getType function, so we need to go into it and find out what goes wrong.
Let’s add another breakpoint - this time, let’s use the second method. We can add breakpoints from the script debugger by clicking on the line numbers on the left side of the code view. Let’s click on line 32 which contains the call to getType:
The line number is now highlighted to indicate it has a breakpoint. Let’s resume the script again and press the run button once more. This time, the code pauses at the breakpoint we set from the debugger.
Same as before, let’s click on the resume button once so that we get the image element.
Running the code step by step
We can now step through the code to see how it’s being executed. Any time the code is paused, we can use the buttons on the right next to the resume script button to run code step by step and see what’s happening.
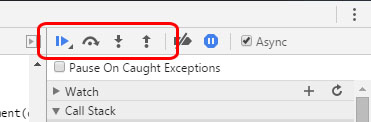
From left to right, they are…
- Resume script execution: The script runs as normal, until another breakpoint is encountered.
- Step over next function call: Executes the currently highlighted line of code.
- Step into next function call: Instead of simply executing the line of code, this will go “inside” the next function.
- Step out of current function: Runs any remaining code in the function as normal and pauses where the function exits.
Let me explain them in a bit more detail.
Step into will go into any function called on the current line. If we use step into when we’re paused on getType, the code would jump to the first line of the function, and you can continue stepping through the code from there. You should use step into whenever you want to know what a function is doing.
Step over executes the current line, but doesn’t step into any function. It still executes the code inside the function as normal. This is convenient if your code is calling a utility function that you’re not interested in, such as jQuery, Lodash, or some other helper. If you’re not interested in what a function does, you can simply step over it, so you don’t need to step through each line of code inside it.
Step out executes the remainder of the code in the current function, and returns you one step out of the call stack. This is convenient when you’re inside a function, but don’t want to step through the rest of its code. You can use step out to go back the where the function was called and continue from there.
You can play around with each of these options to get a better understanding. Simply repeat the run-button / resume script steps from before to return back.
Solving the problem
When we’re paused on line 32 with getType, we want to find out what goes wrong. We can use step into to go inside the function to take a look.
You’ll notice the debugger puts you on the first line of the function. We can now use either step into or step over to run if-clause and see what happens.
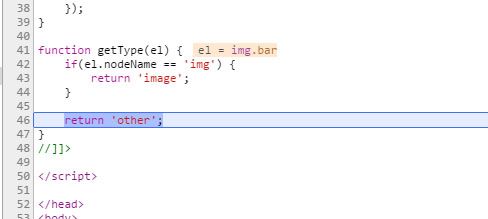
The code execution jumps over the if-statement. This means the condition did not result in a truthy value. Let’s find out why: If you hover the cursor over el.nodeName, we can inspect it and hopefully see why the code isn’t working.
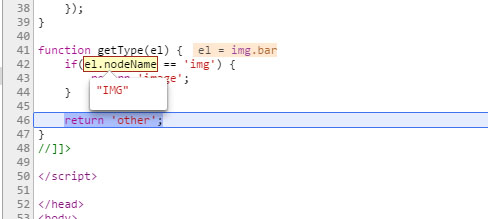
Looks like we found our problem. The nodeName value is in uppercase, while our condition checks for a lowercase value. We’ve identified the cause of the problem and can now fix it.
Conclusion
Chrome’s debugger is a powerful tool and can reduce the time to debug code by a lot. Even better, these same methods can be applied to developer tools in other browsers - including Firefox, Safari and even Internet Explorer.
You can use the methods shown in this article to debug most issues you can run into - breakpoints in particular are a very powerful feature.
This is just scratching the surface. The developer tools have many more useful features in them. I’m considering making this a series of articles, so please leave a comment below if you would like to see more.
Comments or questions?
If you have any comments or questions about this post, feel free to email me to jani@codeutopia.net, or use any of the other methods on the contact page.